Beverages grew almost 4 times faster than food at Nestlé Nigeria in 2026. Are drinks becoming its growth engine?
Nestlé Nigeria's beverage revenue rose 19.9% in 9 months of 2026 while food rose 5.4%. Beverages were 37.6% of revenue but delivered 66.3% of the growth. STATART asks what the results show, and what they cannot.

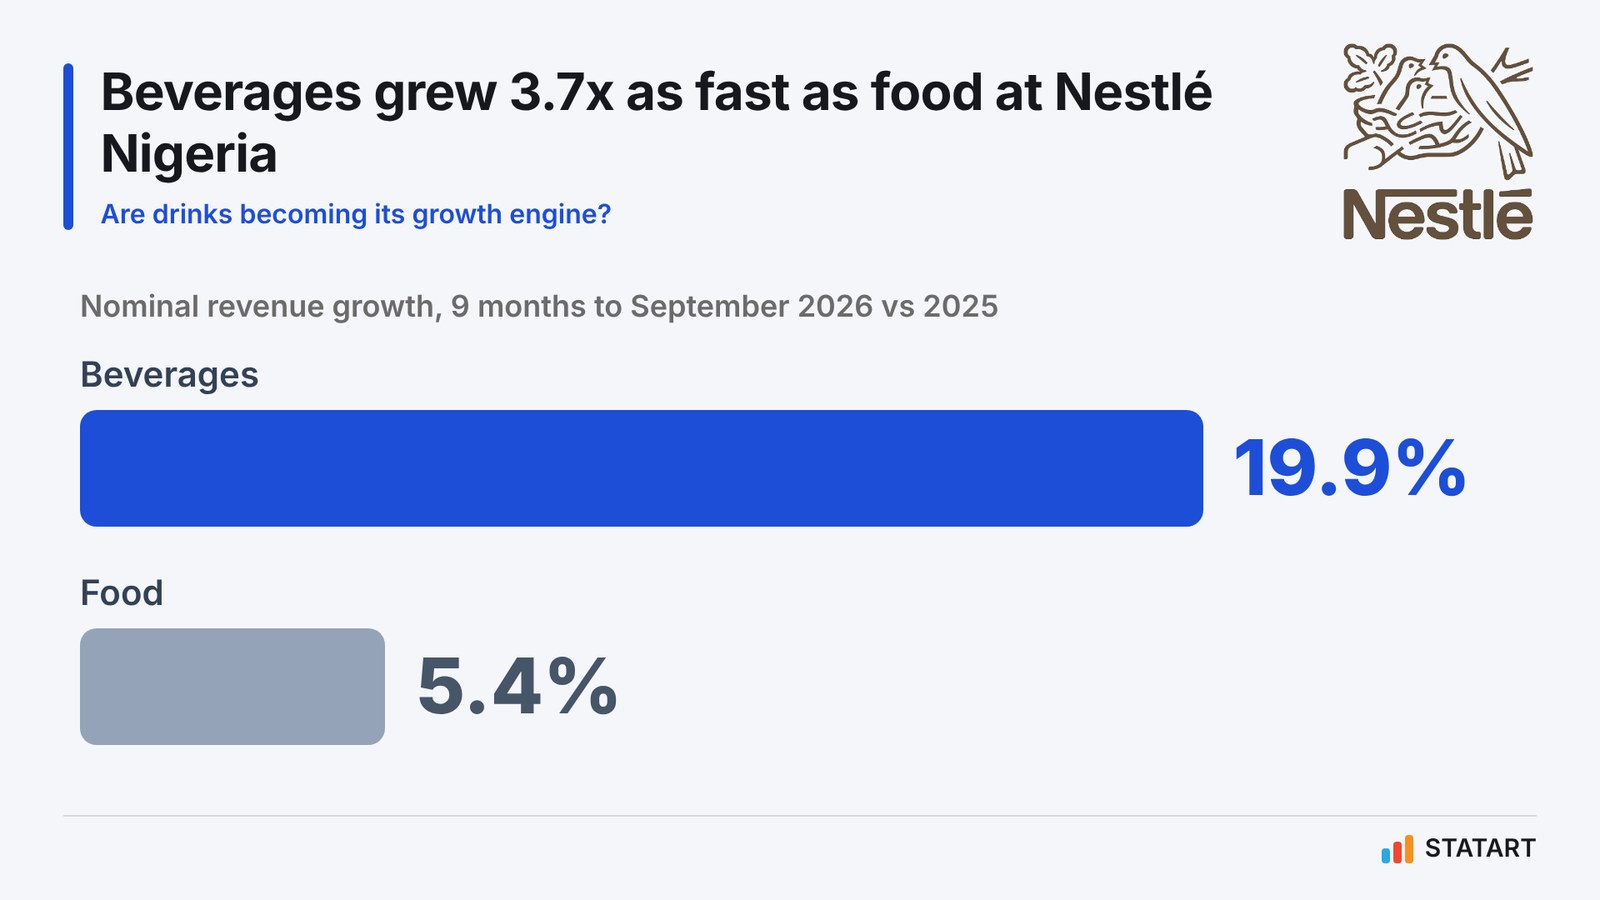
Nestlé Nigeria's drinks are now doing most of the growing. In the 9 months to September 2026, beverage revenue rose 19.9% to N367.16bn while food revenue rose 5.4% to N609.37bn. Beverages grew about 3.7 times as fast as food.
Food is still the bigger business, at 62.4% of revenue. But beverages added about N61bn of new revenue in 9 months against about N31bn from food, so 2 in every 3 naira of Nestlé Nigeria's growth came from drinks. Beverages were 37.6% of revenue but generated 66.3% of the N92bn increase.
Is this real growth or just inflation?
Inflation is part of the backdrop, but these figures cannot separate price from volume. NBS data show average food inflation of 15.72% in the 12 months to September 2026. That is a 12-month moving average, so it does not line up with Nestlé's January to September comparison, and the NBS food basket is far broader than Nestlé's products.
Nestlé does not publish volumes or its own price changes. Revenue growth in either segment could reflect higher prices, a change in product mix or more units sold, and the published figures do not show how much each contributed. What they do show is that inside the same company, over the same months, beverages grew far faster than food, and delivered most of the new revenue.
Source: Nestlé Nigeria 9M 2026 financial statements. Revenue shares refer to 9M 2026; growth contributions compare 9M 2026 with 9M 2025. Chart: STATART Insights and Analytics
See the numbers
| Beverages | Food | |
|---|---|---|
| Share of total revenue | 37.6% | 62.4% |
| Share of revenue increase | 66.3% | 33.7% |
Did promotions buy the growth?
Marketing and distribution expenses rose 32.8% to N148.39bn, and consumer promotional spending rose to N60.78bn from N37.04bn, an increase of about 64%. As a share of revenue, promotional spending rose from about 4.2% to 6.2%, so it grew faster than sales.
Consumer promotional spending increased substantially alongside beverage revenue. However, Nestlé's published figures do not establish how much promotional expenditure went to beverages or whether that spending caused the segment's faster growth. The beverage segment's operating margin slipped slightly, to about 17.8% from 18.2%.
How much of the growth would hold if promotional spending were cut is an open question. The company as a whole still became more profitable: gross margin improved to 40.23% from 36.95%, and pre-tax profit rose 51.5% to N193.88bn.
How big is Nestlé Nigeria next to its listed rival?
On scale, Nestlé Nigeria is far ahead of its listed rival in drinks and confectionery. Its 9-month revenue of N976.53bn was about 7.7 times Cadbury Nigeria's N126.69bn. Cadbury's domestic sales rose only about 1.8% to N116.29bn, while its exports doubled.
Cadbury is not a like-for-like comparison. Its domestic revenue includes products outside beverages, while Nestlé's beverage revenue may include exports. The figures show the difference in company size, not a change in market share in any product category.
What would it take for drinks to overtake food?
If beverages kept growing at 19.9% a year and food at 5.4%, beverages would reach about 41% of revenue within a year, and would overtake food in about 3.9 years. That is a scenario, not a forecast: 2 nine-month comparisons cannot reliably predict 4 years of performance. But it shows how quickly the shape of the business could change.
Nestlé Nigeria is far larger than its listed rival Cadbury, and drinks are now its main source of growth: beverages were 37.6% of revenue but delivered 66.3% of the increase. Financial statements show where revenue is changing, not why. Whether the gap reflects pricing, product mix or more units sold, and whether the faster rise in promotional spending is paying off, are questions for shelf audits and consumer research, not the next set of results alone.
Sources: