STATART Studio.
Turn statistics into moving market intelligence. Animated charts, racing visuals, dashboards, and data stories, built by STATART Insights and Analytics for creators, researchers, businesses, and media teams.
Three houses of editorial, motion and market statistics
One design language, three ways to tell a data story. Built in Nigeria for Nigerian, West African and African markets, and made to stand beside anything in the world.
Editorial Statistics
The printed voice of the data.
Magazine-grade layouts. Long-form data essays, pull-quote stats, annotated features and cover stories that read like a national title, not a dashboard.
Statistics in Motion
Numbers that move the feed.
Bar races, animated timelines, counting odometers and reveal sequences built for reels and shorts. The scroll-stopping half of data storytelling. Every finished video downloads in your choice of format: MP4, MOV, WebM, MKV, or GIF.
Market Statistics
Research grade, post ready.
The working house. Twenty branded engines from story cards to TAM sizing and company scorecards, each source stamped and export ready in six themes.
Whatever the house, the work carries the same signature.
Every figure stamped to CBN, NBS, NCC or NGX. No number ships without a source.
Shared palette, type and grid, so a STATART visual is recognisable from across the room.
Dark and light, restyled in a click to fit the campaign, the client or the platform.
Four aspect ratios, Excel in, PNG out. From data to feed without leaving the studio.
Post-ready visuals, straight from your data
Every visual carries your headline, a source line, the STATART mark, and a confidence grade. Pick a signature layout, then export square or portrait for social, decks, and reports.
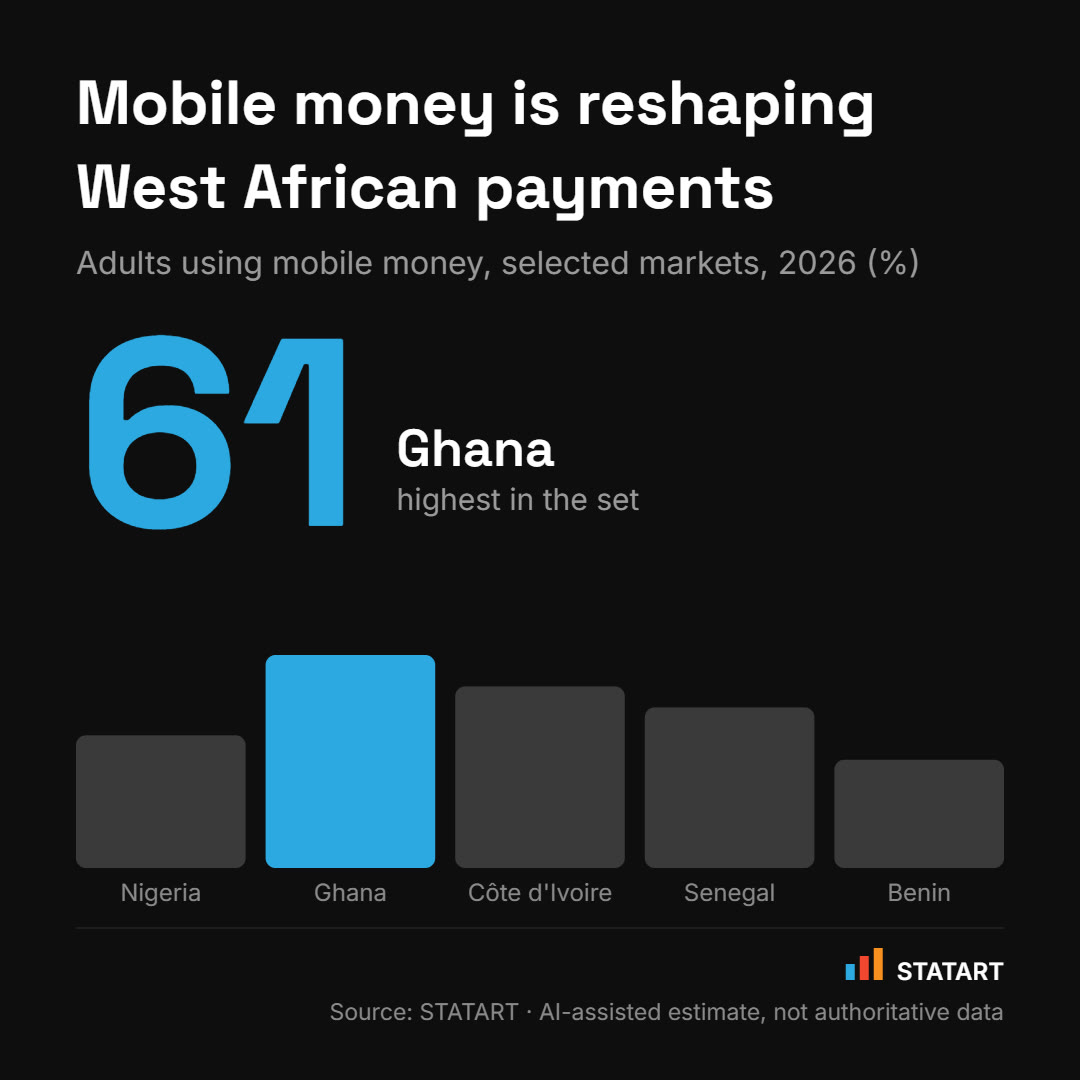
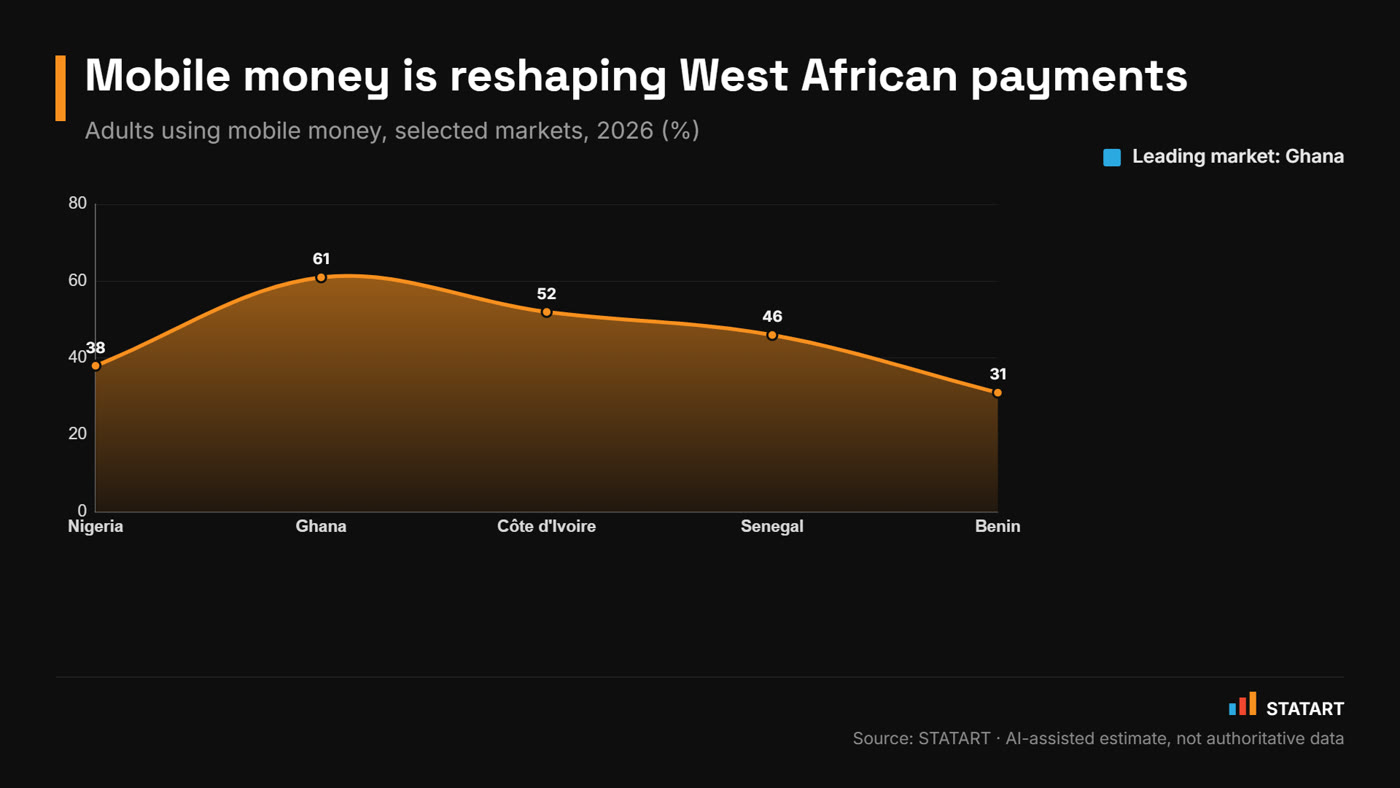
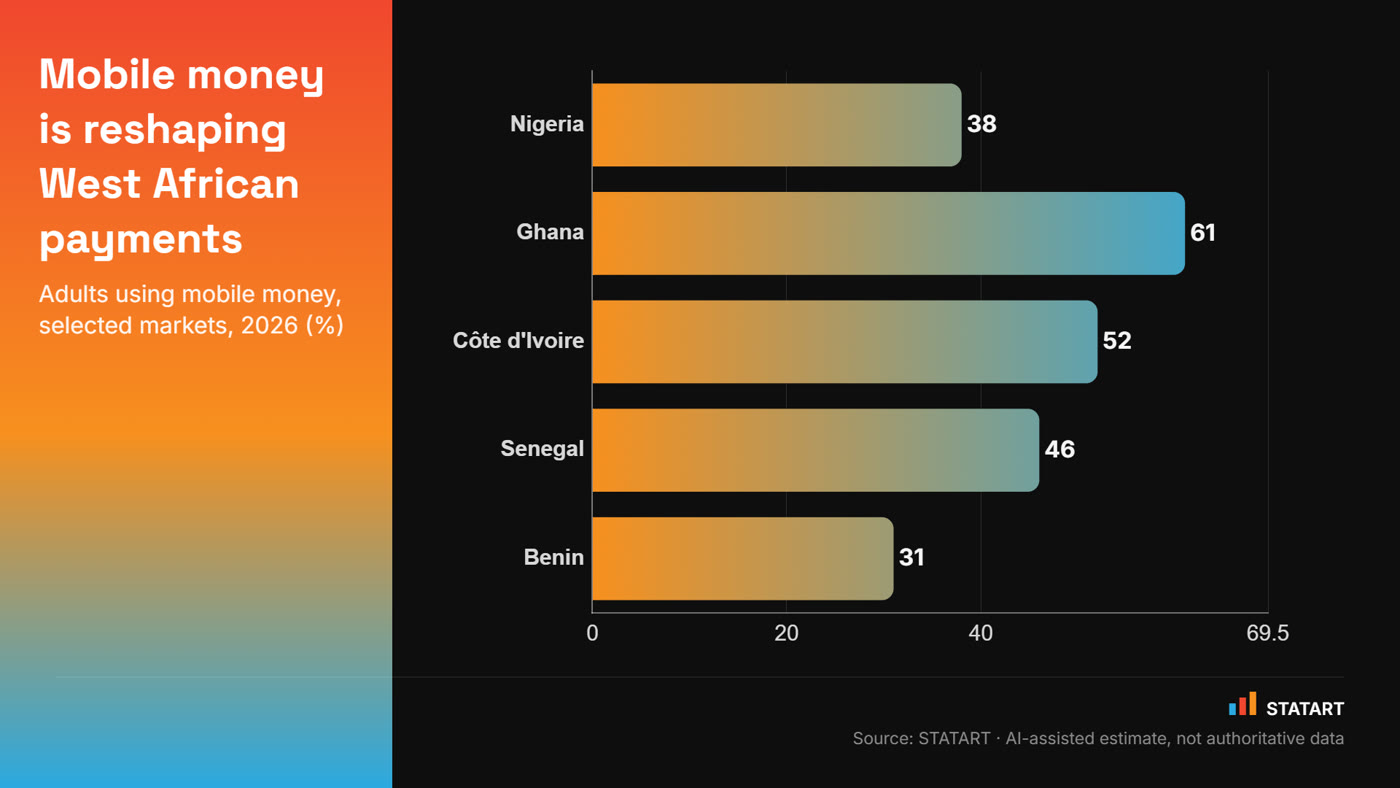
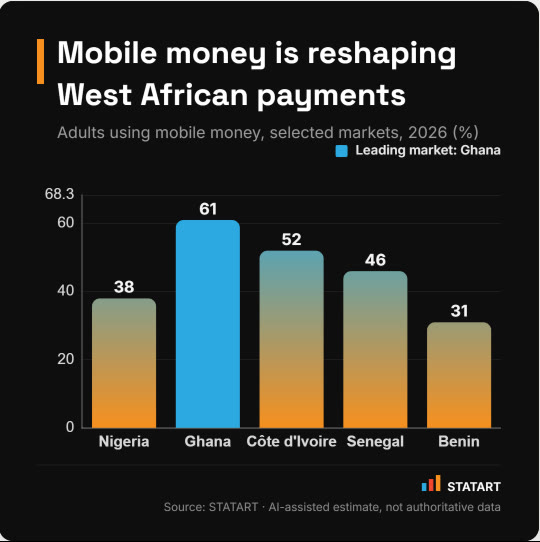
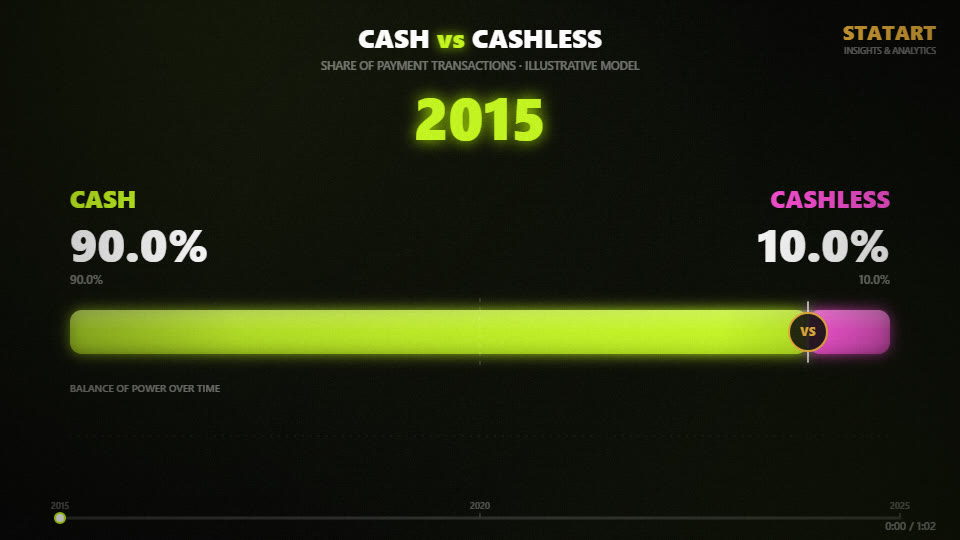
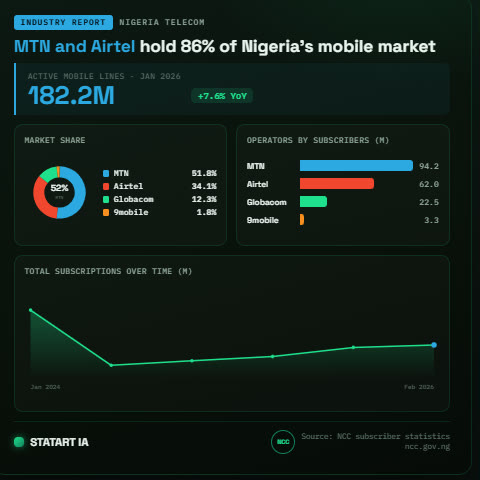
Straight from the Studio engines
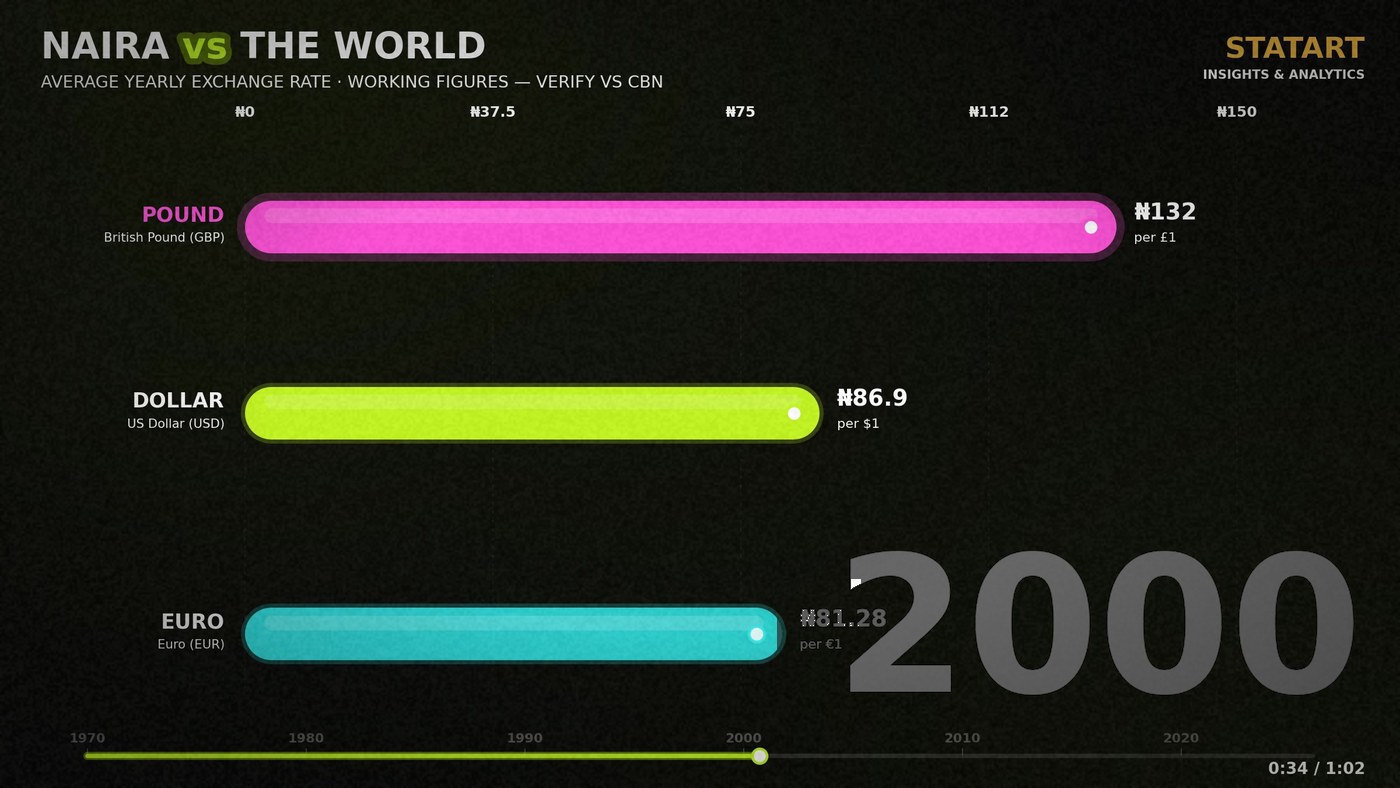
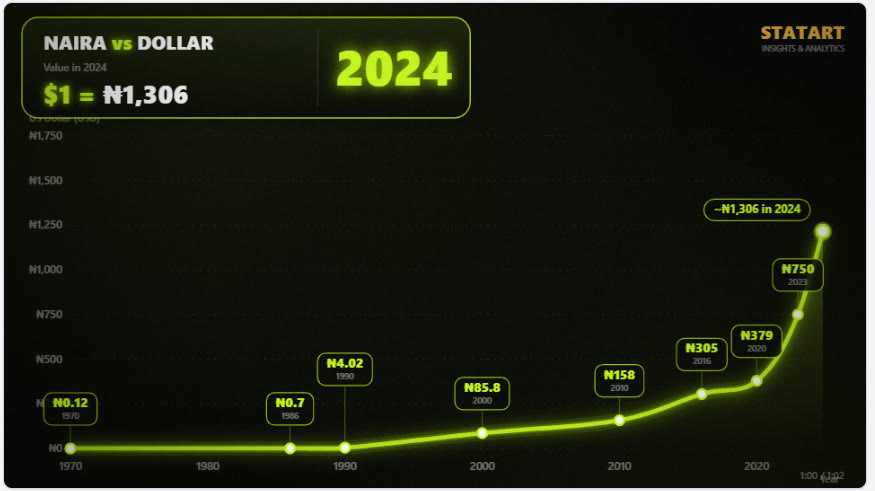
Frames from an actual STATART motion render: Naira vs The World, produced by the Statistics in Motion house at 2400 by 1350 HD.
The same trusted frame under every engine
Editable branding
Your headline, colours, and logo, applied to the STATART house style in one place.
Built-in data sheet
A simple data table with CSV in and out, so the numbers stay with the visual.
Four social ratios
Export square and portrait, sized for feed, story, deck, and report.
Confidence graded
An A, B, or C grade shows how firm each figure is, from official to illustrative.
Source stamped
Provenance travels onto every visual, with NBS, CBN, NCC, or NGX noted where used.
Offline first
Engines run offline, so you can build from anywhere and export when ready.
Data should not stay hidden in tables
Many valuable statistics sit locked inside spreadsheets, reports, PDFs, survey forms, and government publications. STATART Studio brings those numbers to life through clean visual storytelling, so figures become easier to understand, easier to share, and easier to use for decisions.
A table can show the numbers, but a strong visual shows the movement, the pattern, the ranking, and the meaning behind them. Every chart is built to explain a real question, show a real movement, or compare a real market pattern; serious data communication, not decoration.
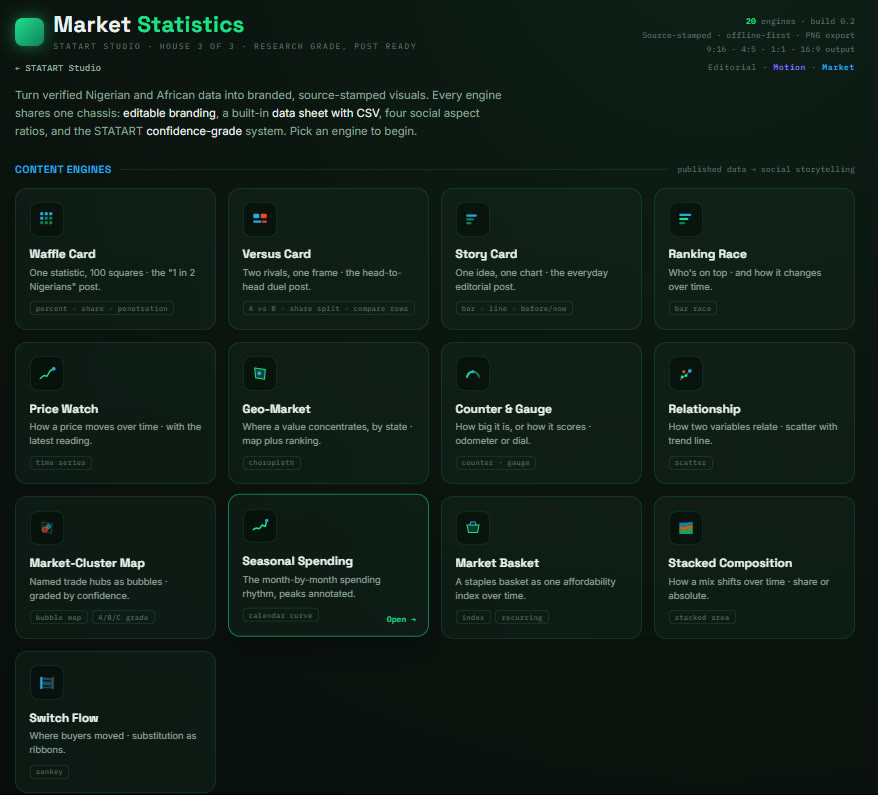
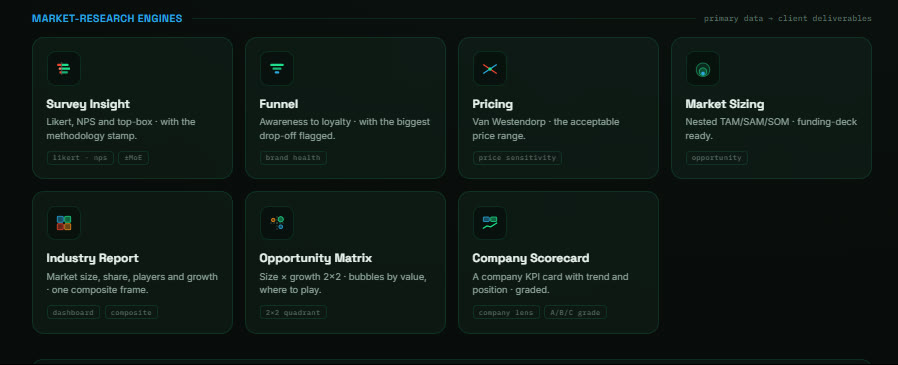
Twenty engines, two families, one chassis
Content engines for social and editorial storytelling, and market-research engines for client deliverables. Each reads from a source-stamped data sheet and exports on the same frame.
Inside the Market Statistics house
The live working house: every engine on one chassis, source stamped, offline first, and export ready.
Nine cinematic formats that make numbers move
Beyond still charts, Studio animates the story: racing bars where currencies and brands battle for the lead, market-share donuts that breathe as the years roll, countdowns that reveal the number one with suspense, and duels that cross the 50 percent line on screen.
One-tap market stories
A story gallery of ready-made Nigerian market datasets: naira history, telco share battles, top banks, digital payments, and more. One tap loads the sheet, the title, and the best-fit format.
Scored like a film
Every video carries a live generated soundtrack, from gentle piano to cinematic build, recorded straight into the download. Pick the length, from thirty seconds to three minutes.
Broadcast-grade exports
Final renders come out of the STATART engine at 2400 by 1350 in MP4, MOV, WebM, MKV, or GIF, ready for social, presentations, and media publishing.
Six ways to look
Three dark and three light palettes, each blended so your highlight colour carries through every element of the chart. Ten display fonts restyle the whole card in a click.
Built around the questions that matter
FX History
Track how one currency has changed against another over time. Naira vs Dollar, Pound, Euro, Yuan and more, with start value, current value, percentage change, and dynamic year by year movement.
Request a demoRanking Race
Show how rankings shift over time with animated bar chart races and leaderboards. Top states by IGR, African economies by GDP, banks by market capitalisation, telecom operators by subscribers, and more.
Request a demoPrice Watch
Track the movement of everyday prices and market costs: rice, bread, beans, garri, tomatoes, fuel, cooking gas, cement, transport fares, rent, and school fees.
Request a demoGeo-Market Map
Visualise location based data with maps, bubbles, rankings, and regional dashboards. Companies per state, SME concentration, business density by LGA, startup clusters, and city level activity.
Request a demoMarket Share
Show how markets divide across companies, brands, sectors, platforms, or consumer choices. Telecom share, banking distribution, payment preference, and GDP contribution by sector.
Request a demoSurvey Insight
Turn questionnaire and survey data into clean visual stories. Consumer behaviour, customer satisfaction, brand perception, price sensitivity, payment preference, and product awareness.
Request a demoOne platform, many kinds of users
Content Creators
Produce statistics based content for LinkedIn, Instagram, TikTok, YouTube Shorts, X, and newsletters that looks professional and communicates clearly.
Market Researchers
Turn survey results, field research, and market findings into visual outputs that clients understand quickly.
Businesses
Create branded visuals for business reports, investor updates, board presentations, and market intelligence updates.
Media Teams
Publish economic rankings, market updates, and data explainers with clear animated visuals.
Analysts and Educators
Explain trends, comparisons, and statistical patterns with visuals that support learning and interpretation.
From data to finished visual
Add your data
Enter structured data into the chosen tool: currency, prices, survey results, business counts, rankings, market share, or geolocation figures.
Choose a chart type
Pick the format that fits the story: a line chart for trends, a bar race for rankings, a map for location, or a donut for market share.
Customise your visual
Edit titles, labels, year display, number format, colours, logo settings, and source note in the brand style.
Generate your content
Create static or animated visuals ready for social media, presentations, reports, dashboards, and newsletters.
Licensed access, built for fair use
STATART Studio is available through controlled licensed access. Personal users create clean visuals at their license level; business users add their own logo and brand identity; agency users access approved multi-brand options for client work. Usage terms keep access fair and protect the platform.
The platform, templates, chart systems, and design framework remain the property of STATART Insights and Analytics. Users receive licensed access to create approved visuals.
Request a STATART Studio demo
Studio is available through controlled licensed access, so we walk every new user through it personally. Tell us a little about you and our team will schedule a live demo built around what you want to create.
Turn your data into visual intelligence
Request a demo today and see how Studio builds professional data visuals for market research, business intelligence, economic storytelling, and statistics based content.
Or reach us: support@statartinsightsandanalytics.com · WhatsApp